
KEY TAKEAWAYS
- A BI team managing nearly 20 projects across several continents built an Obeya room and doubled on-time delivery in 3 months.
- The Obeya surfaced milestone collisions, quality failures, and ownership gaps that no status report had ever shown.
- Three PDCAs run inside the Obeya rescued a go-live, halved defects per delivery, and created a standard that the team still uses.
Get the Full Project Obeya Template with all the boards layout: Strategy, performance, macro planning, and problem-solving. Ready to print and fill in.
[Download Free Template →]
A team of project managers ran nearly 20 Business Intelligence projects across several continents. On-time delivery sat at 24%. One of four projects hit its deadline. The rest slipped, and every delay rippled into the group’s financial reporting.
The division head could not see where projects actually stood. Status reports arrived late, told different stories depending on who wrote them, and never revealed the collisions between milestones until it was too late. Client satisfaction had dropped to 5.5 out of 10.
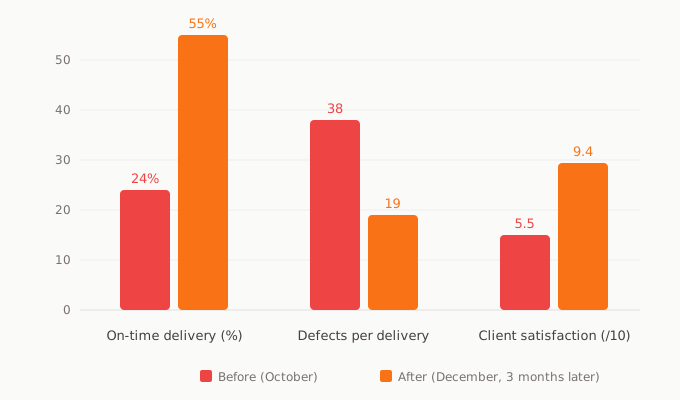
I was brought in to fix project delivery performance. What I built with the team was an obeya room, a physical space where every project, every metric, and every problem lived on the walls. Three months later, on-time delivery reached 55%. Defects per delivery dropped from 38 to 19. Client satisfaction climbed to 9.4.
Here is how it happened.
The Starting Point
The team sat inside a global enterprise IT department. Two senior project managers, local project leaders spread across several continents, and one external vendor handling development and testing. Nearly 20 BI projects running simultaneously, building reports and dashboards for business teams worldwide.
When I arrived, the two project managers were each tracking their own projects in spreadsheets and via email. There was no shared view of the projects. I asked where I could see the status of all projects, whether separately or together, and nobody could point me to a single, coherent view. Each project manager knew their own projects well, but neither could tell me how their timelines affected each other’s. There was no tracking of the actual vs. target lead time, defects, cost, or real customer satisfaction.
The numbers confirmed what the organization already felt. Only 24% of milestones were delivered on time. Defects per delivery stood at 38. Client satisfaction scored 5.5 out of 10, and it was trending down.
Project managers lacked a core skill: the ability to see problems before they became crises. They managed projects through documents, email threads, and weekly status meetings. When something went wrong, they discovered it afterward. By then, the damage was done.
Building the Obeya Room
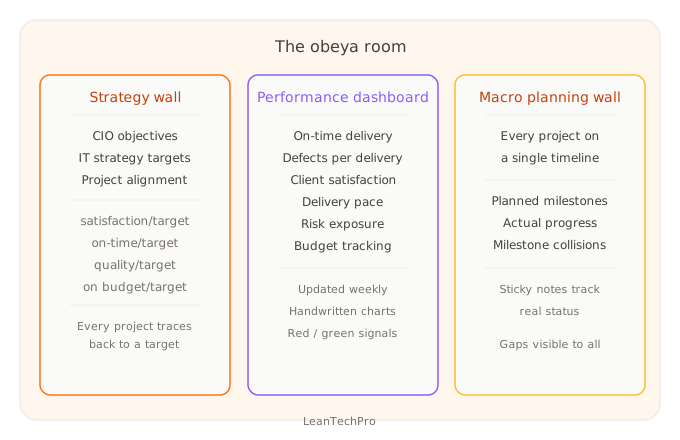
I designed the Obeya around three zones. Each zone answered a different question.
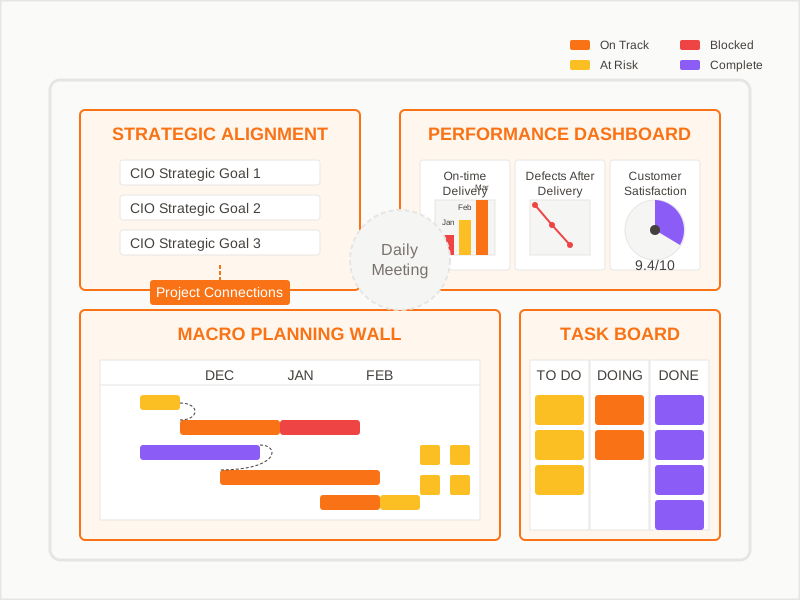
Strategy wall. This connected every BI project objective to the CIO’s strategic goals. The IT strategy was clear: end-user centric, business-oriented, result-driven. Leadership had set explicit targets for customer satisfaction, on-time delivery, quality, and budget. Every project on the wall had to trace back to one of those targets. If it did not connect, the team had to ask why they were doing it and lead a clarification with the management.
Performance dashboard. Six handwritten charts on the wall, updated weekly: on-time delivery rate, number of defects per delivery, client satisfaction scores, delivery pace (cumulative projects delivered), risk exposure, and budget tracking. Every chart showed the trend line over time. Red meant below target. Green meant on track. No hiding behind averages or quarterly summaries. The team saw reality every week.
Macro planning wall. Every project is plotted on a single timeline over months. Every project listed its phases: scoping, development, testing, UAT, training, communication, and go-live. Planned milestones marked with symbols. Actual progress tracked with sticky notes. When two milestones collided in the same week, the wall showed it. When a project fell behind, the gap between planned and actual was visible to anyone who walked into the room.
With the project managers and their leaders, we built the first version (prototypes) of the Obeya in a 2-day hands-on workshop. We had large sheets of paper taped to the wall, hand-drawn charts, and printed timelines. Once back in their office, the project team plotted every project on the macro planning wall and updated the performance charts, along with the actual projects’ status. On the wall, we had every project, every milestone. The team had never seen their own workload displayed like that. We started to see every conflict, especially as we gained visibility into the future ones. One of the project managers said something like “now I understand why we keep missing dates.”
The project managers also added a simple task board next to the planning wall, with three columns: to do, doing, done. It tracked the daily actions tied to the projects, so nothing fell between two weekly sessions.
What the Obeya Revealed
The macro planning wall showed what no status report ever had: milestone collisions. Projects competed for the same testing resources in the same weeks. Go-live dates piled up at the end of the quarter because nobody had seen the full picture until now.
The performance dashboard forced factual conversations. Before the Obeya, discussions with the division head were opinion-based. Who was on track? It depended on who you asked. After the obeya, the numbers spoke. Managers acknowledged this shift directly: discussions became more factual because the data was on the wall, visible to everyone, and updated every week.
The first time we reviewed the performance dashboard together, the division head stopped at the defect chart. He had known deliveries were not clean, but he had never seen the pattern laid out week by week. The trend was clear and getting worse. That was the moment he stopped asking “are we on track?” and started asking “what is causing this?”
The wall also revealed a more uncomfortable truth. Defects kept surfacing after delivery, and no one had tracked the pattern until the charts made it undeniable. The data did not point at people. It pointed at a testing process that let those defects through.
Three PDCAs Inside the Obeya
The Obeya made problems visible. PDCA solved them. Three structured problem-solving cycles ran during that engagement.
Rescuing a Go-Live
With eight weeks to go-live, not one of the project’s twenty-plus planned reports had been validated. At about a day per report to pre-check and validate, the math did not work. The project faced a slip of a week or two, which would hit the business.
Root causes: nobody had sized the actual work against the delivery dates. The developer did not know how many objects he had to test or the total scope of the project. The development database lacked representative data, with dozens of anomalies traced to data gaps.
Actions: The project manager asked the team to report every couple of days on verified reports versus the total. Tech copied the production database into the development environment, allowing testers to work with real data. The team dedicated one business expert full-time to pre-checks and validation for the final stretch.
Result: every report was delivered, pre-checked, and validated before the deadline. On time.
Fixing Defects at the Source
One afternoon I sat next to a developer on the delivery team and watched him execute a test script. He opened a report, exported it to PDF, and checked “OK” on the test line for the export. I looked at the PDF. The user name was missing. The execution date was missing. I asked him why he marked it OK. He looked at the test script again and pointed to the line: “verify PDF export.” It did not say “verify that the user name and execution date appear in the PDF export.” He had tested exactly what was written. Nothing more. He was not careless. The test script was incomplete, and nobody had ever watched him work to see the gap.
The test script did not list all the fields that needed verification during PDF and XLS exports. The developer checked what was written, not what mattered. During the observation, the developer also told me he needed the most critical and most frequent use cases from the business, which nobody had provided.
Fixes: We updated the test script to include the missing verification items. We identified the most-used and most critical test cases from the business and handed them over to the development team. We created a test template with a cover page so developers only entered their name once, rather than on every test item.
Defects per delivery dropped. The team standardized this approach: at the end of every scoping phase, collect the critical use cases from the business and provide them to development before coding starts.
Managing Local Projects
A client complaint landed: more than a dozen missing functionalities and a delayed delivery on a local project (run by a local subsidiary, outside the central IT team’s direct oversight). The project manager team had no process for managing local projects. They had no visibility on progress, no defined roles between the business and IT, and no way to follow delivery during the build.
One project manager audited the project value stream and recommended corrective actions. The project team then ran a workshop to define roles, responsibilities, and guidelines for local projects. They created a Local Project Implementation Checklist covering every phase from identification through roll-out: when to share guidelines, when to supply development environments, when to do mid-term code reviews, and what the definition of done looked like for each gate.
The project team did not resist defining the standard. They resisted the idea that they needed one. Local projects had always been “the business’s problem.” Once the client complaint made it clear that the central team’s reputation suffered regardless of who ran the project, they accepted ownership. The workshop produced the checklist in one day.
The standard was ready a few weeks later. The team applied it immediately to the next local project.
The Results
Three months passed, and the same project team continued to manage their projects with the same vendors. The performance shifted across all three indicators: delivery, quality, and customer satisfaction. Delivery pace accelerated from 9 projects delivered in October to 27 by December.
The CIO came to the Obeya in late November with the division head. He walked the macro planning wall from left to right, stopped at two projects with overlapping milestones, and asked the team what they were doing about it. The project managers answered directly, pointing at the wall, no slides, no preparation. After the visit, the team stood a little taller. Leadership had seen their work, their problems, and their method for solving them.
The division head adopted the obeya as his primary management tool. Budget conversations became data-driven. Risk discussions focused on the wall rather than circling through opinions.
Beyond the metrics, the Obeya changed how the team worked. Discussions moved from “I think we are on track” to “the wall shows we have three milestones colliding in the same week, so which one do we move?” Conversations about quality shifted from frustration to root-cause analysis. Project managers who had worked in isolation started solving problems together because they could see each other’s projects on the same wall. They started to learn.
What Made It Work
The Obeya did not add a process. It made existing problems visible so the team could solve them. It helps as a discovery tool for better risk management.
Three things mattered. The handwritten charts on the wall, updated weekly, created accountability that no digital dashboard could match. When your numbers are on the wall, and the stakeholders see them every week, you do not let them slide.
The PDCAs forced the team to go beyond symptoms. ‘Deliveries are late’ is a complaint. “The test script does not list all required verification fields” is a root cause you can fix.
And the macro planning wall gave the division head something he never had: a single view of every project with their real status, not the filtered version from a status report.
If you manage multiple IT projects and your delivery rate sits below 50%, the problem is rarely that your project managers lack skills. They lack visibility. An Obeya room gives them that visibility, and with it, the ability to act before problems become crises.
Download the Virtual Project Obeya Template to see the boards we used, with placeholder fields you can adapt to your own projects.
Get the Full Project Obeya Template with all the boards layout: Strategy, performance, macro planning, and problem-solving. Ready to print and fill in.
[Download Free Template →]
This case is drawn from a real engagement. The client, the project, and some figures have been anonymized or generalized to protect confidentiality. The methods, the sequence, and the outcomes are unchanged.